Career Star
Every U.S. occupation gets one 0–100 risk-adjusted score, the way an analyst would rate a stock. I started it in May 2026, tested whether it would have been right in the past, and presented it to Capital One in August.
Every U.S. occupation gets one 0–100 risk-adjusted score, the way an analyst would rate a stock. I started it in May 2026, tested whether it would have been right in the past, and presented it to Capital One in August.
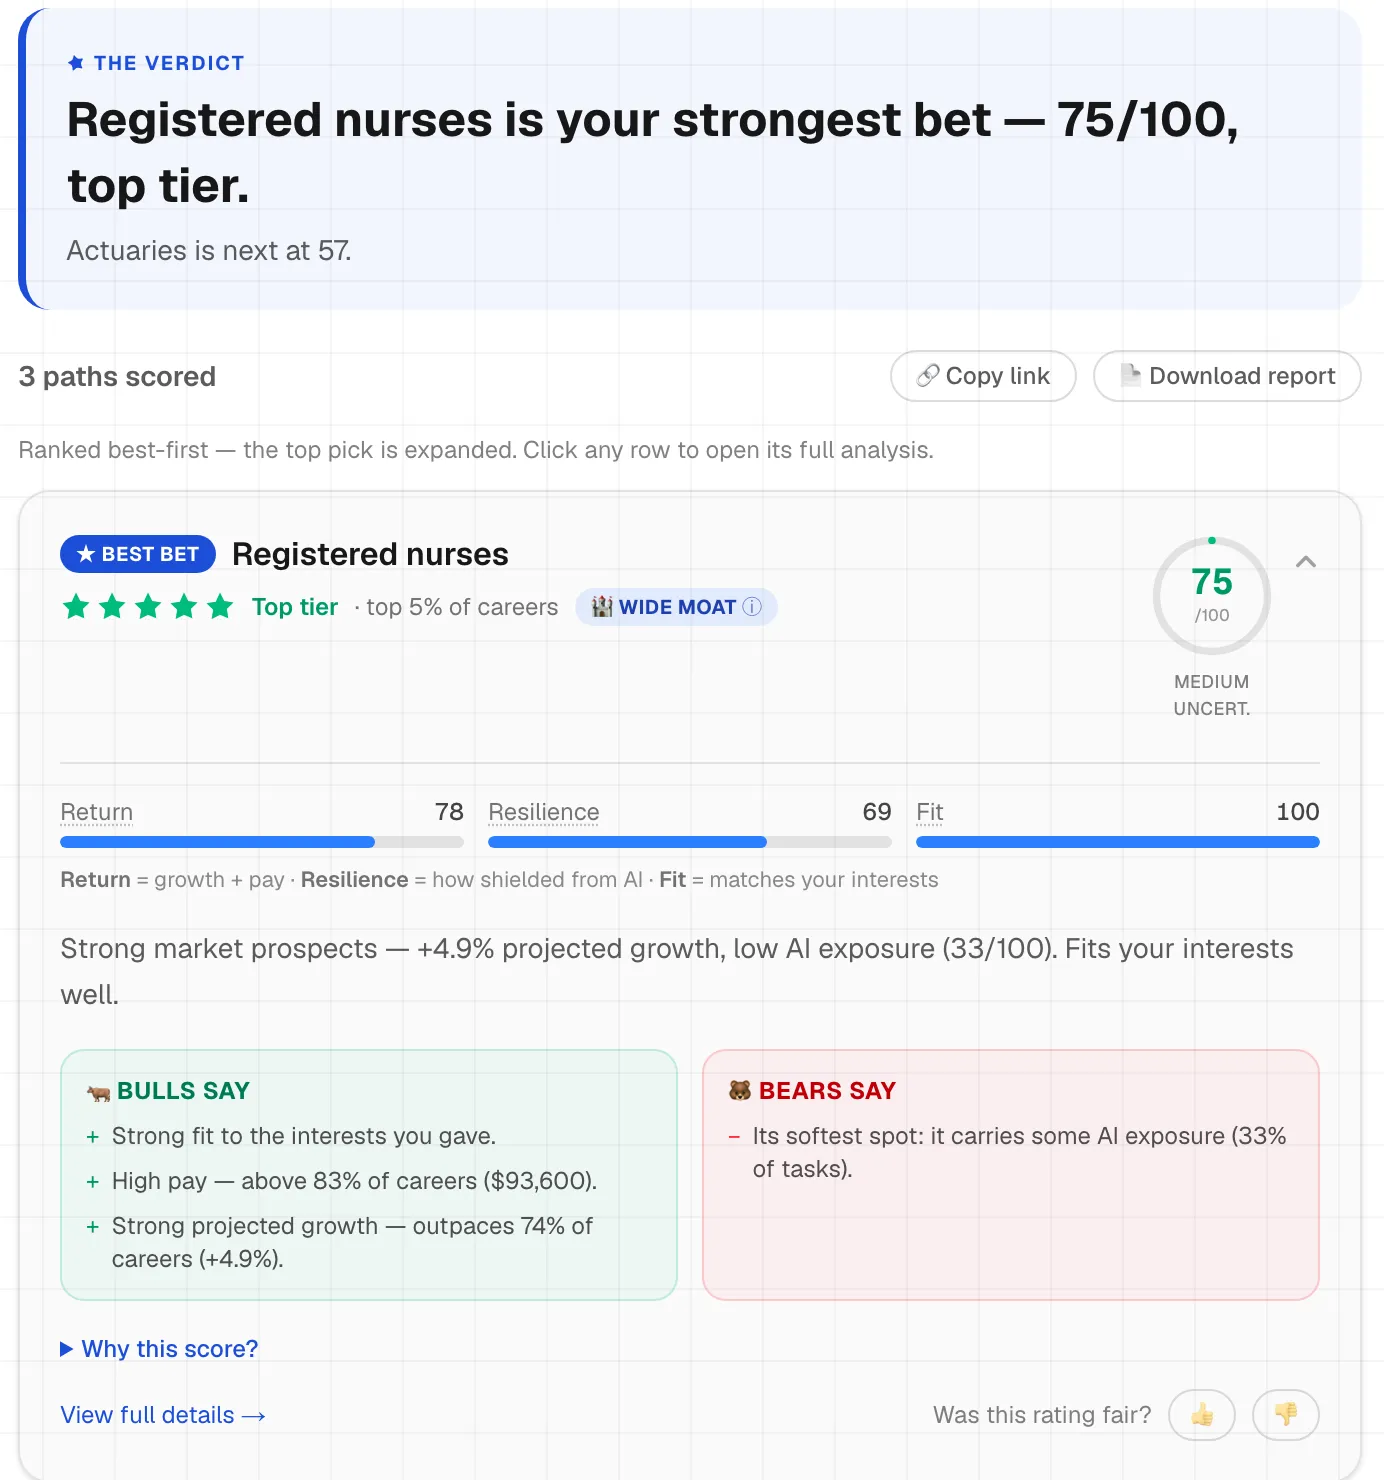
Most career advice I found was either general encouragement or a single salary number. I wanted a way to compare careers the way you'd compare stocks: expected return, risk, and how well each one fits the person asking.
My own project, start to finish. I designed the scoring model, built the app, and set up hosting on AWS Amplify with Route 53, with CI through GitHub and a 35-test automated suite. I built it spec-first with Claude Code and BMAD: the PRD and the architecture came before any code. It grew out of a stock recommendation project I did in Intro to CS I Honors. In August 2026 I gave a 15-minute presentation on it to Capital One.
Growth and pay are percentile ranks across all ~730 careers from Bureau of Labor Statistics and O*NET data, so every input sits between 0 and 1. Risk discounts return, and fit is blended in last.
I recovered the 2014 edition of the labor data from the Internet Archive, scored that market with today's model, and compared the ranking with what actually happened by 2024. Across 647 occupations the rank correlation was ρ = 0.39, and the careers it flagged as risky really did decline more often than chance: 1.45× as often.
I also moved every weight ±20% on a three-level grid, 36 = 729 weightings in all, and the ranking held. When the top two careers are close, the app says it's a close call instead of overselling a shaky first place.
In 2014 the model liked oil-and-gas jobs, and then the oil crash happened. No occupation-level model sees a shock like that coming, so I list the misses by name.
The raw BLS projection alone scored slightly higher (ρ = 0.41), because AI risk had nothing to predict in a decade before language models. That's the honest claim: the AI exposure term is a bet on the future.
I caught my own methodology page being wrong. It said Fit was O*NET skill-vector similarity, but when I read my data file, Fit was really a keyword match.
So I rebuilt Fit properly: a 68-dimension O*NET vector per occupation (35 skills and 33 knowledge areas), cosine similarity, z-scored against the labor market. The reconciliation is committed in the repository, verdict by verdict.